Debugging with Xdebug
What is Xdebug?
Xdebug is an extension for PHP, and provides a range of features to improve the PHP development experience.
Step Debugging
A way to step through your code in your IDE or editor while the script is executing.
Improvements to PHP's error reporting
An improved var_dump() function, stack traces for Notices, Warnings, Errors and Exceptions to highlight the code path to the error.
Configure Qlico in your project to use Xdebug
Qlico in "dev" stage (default) supports debugging using Xdebug.
You can check if it's enabled with phpinfo();
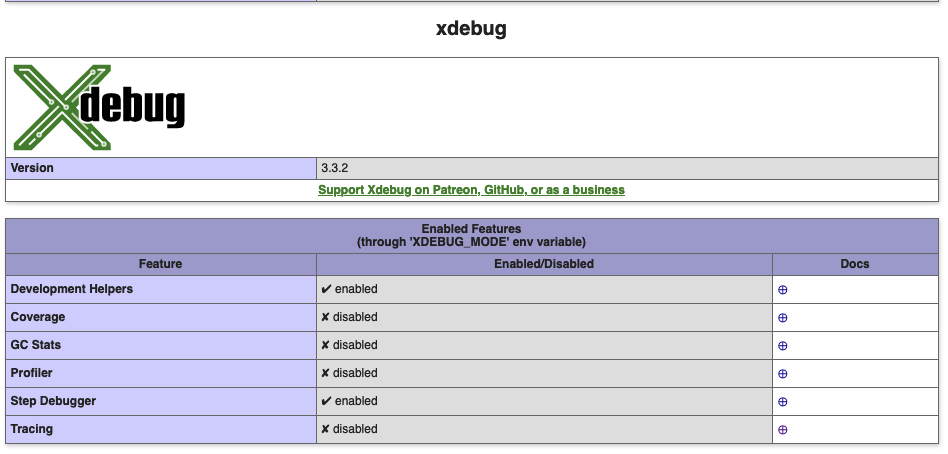
Make sure that in your qlico/.env file the following values are filled:
PROJECT_NAME=unique-project-name this should be an unique project name, if you
have multiple projects with the same name (for example api and frontend)
name your projects: project-api and project-frontend. If these names are not
unique, you will not be able to debug multiple projects at the same time.
XDEBUG_MODE=develop,debug this setting controls which Xdebug features are
enabled.
More information about the different modes
XDEBUG_CLIENT_HOST for macOS users this should be: host.docker.internal
If you're running Linux, you can run and copy the output:
ip addr show docker0 | grep "inet\b" | awk '{print $2}' | cut -d/ -f1
For example:
XDEBUG_CLIENT_HOST=172.17.0.1
Full working example of .env file
PROJECT_NAME=xdebug-example
XDEBUG_MODE=develop,debug
XDEBUG_CLIENT_HOST=host.docker.internal
Configure your IDE
PhpStorm
These instructions also work for IntelliJ IDEA.
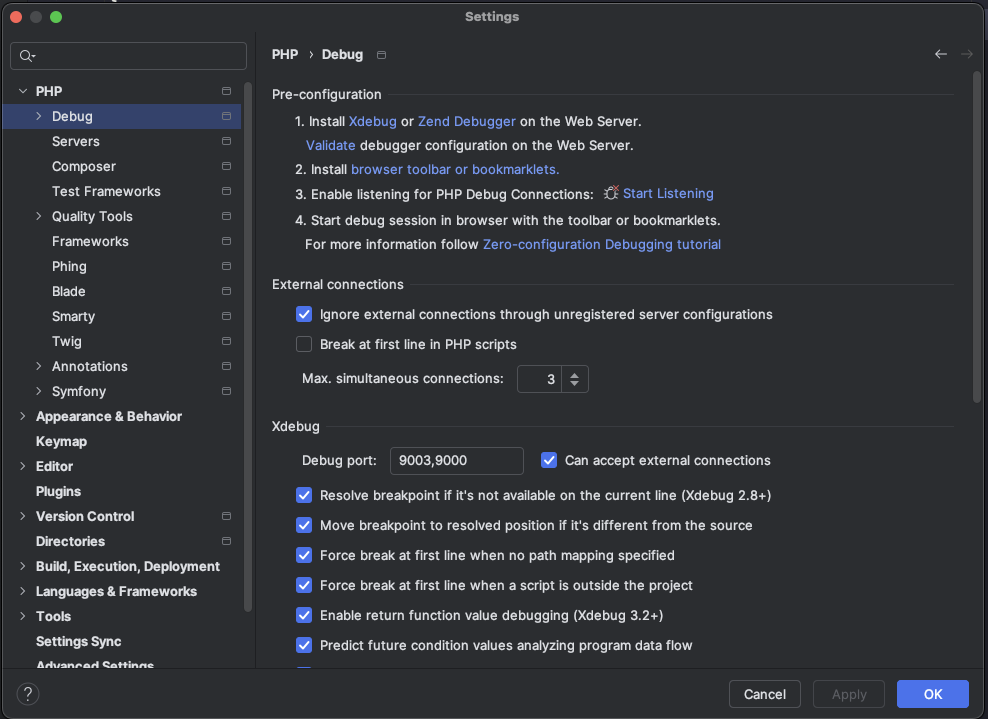
Open the Project settings and go to: PHP -> Debug, make sure that the Debug port is: 9003,9000
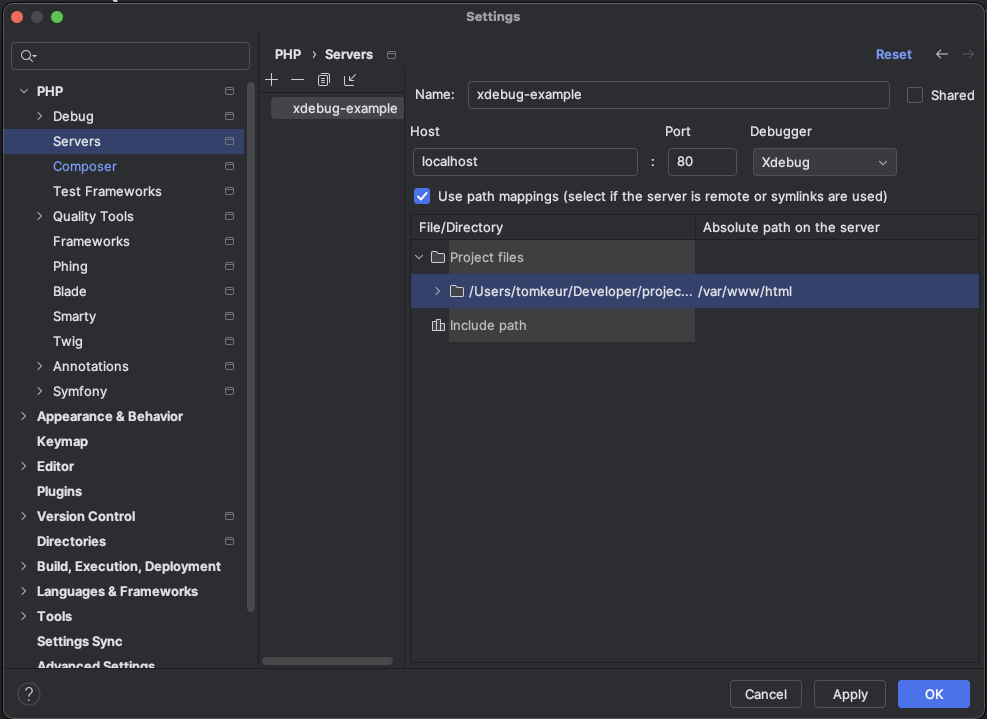
Next to go: PHP -> Servers
Name: xdebug-example Important: This name MUST match the PROJECT_NAME
in your .env file.
Host: localhost
Check: "Use path mappings (select if the server is remote or symlinks are
used)", since we're using a "remote" Docker container.
Absolute path on the server: /var/www/html
Click: "Start listening for PHP Debug Connections" (in the Main toolbar)

After you've clicked the button, the "red" light should be "green"

Set a breakpoint somewhere in your code
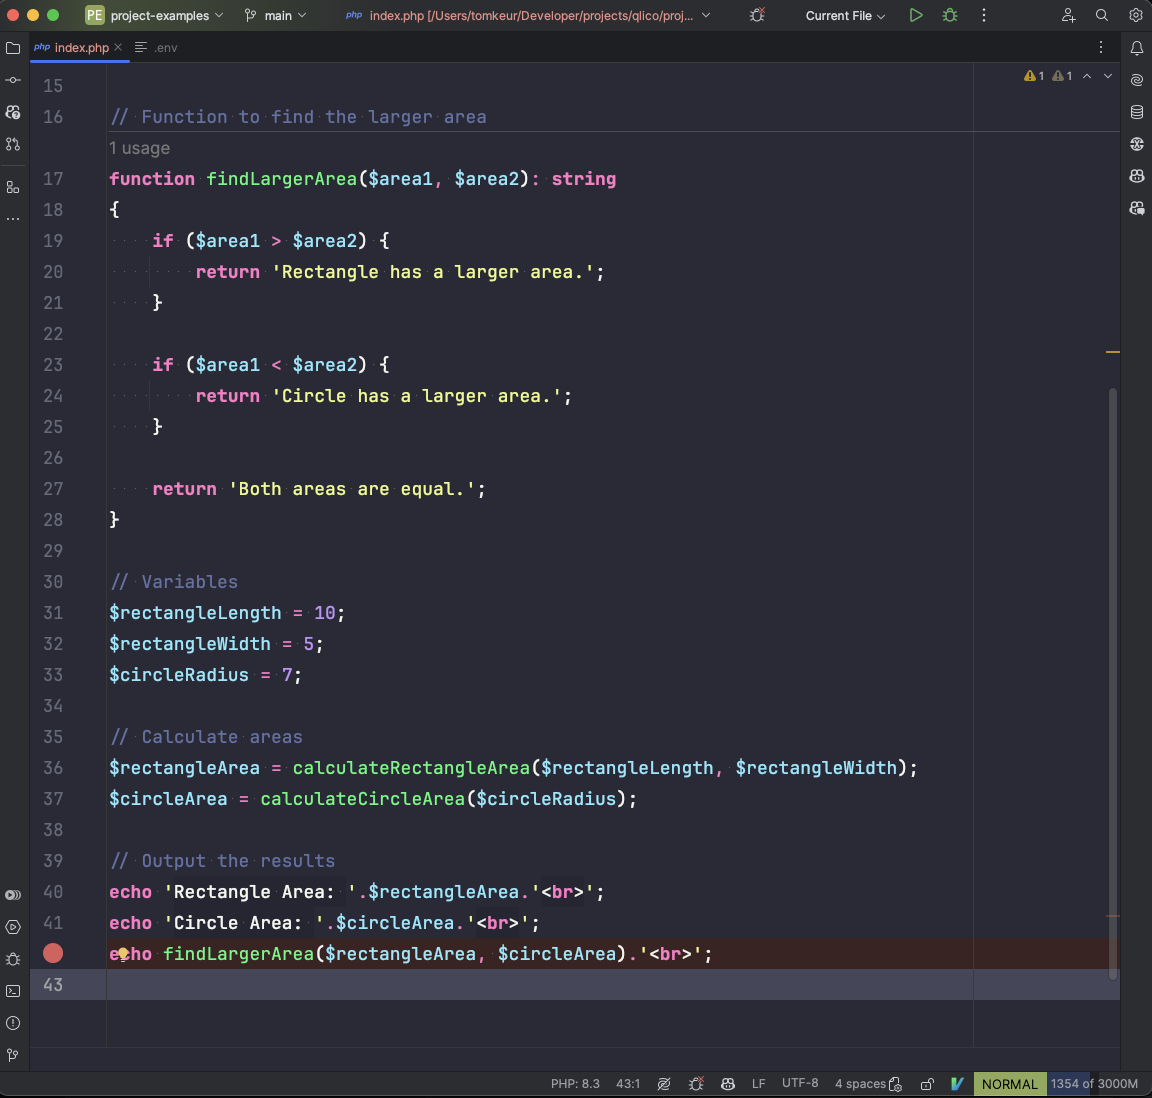
For more information about breakpoints in PhpStorm, click here.
Open your project in a browser
In my example: Visiting http://xdebug-example.qlico
Profit
PhpStorm will automatically open up, with Debug information
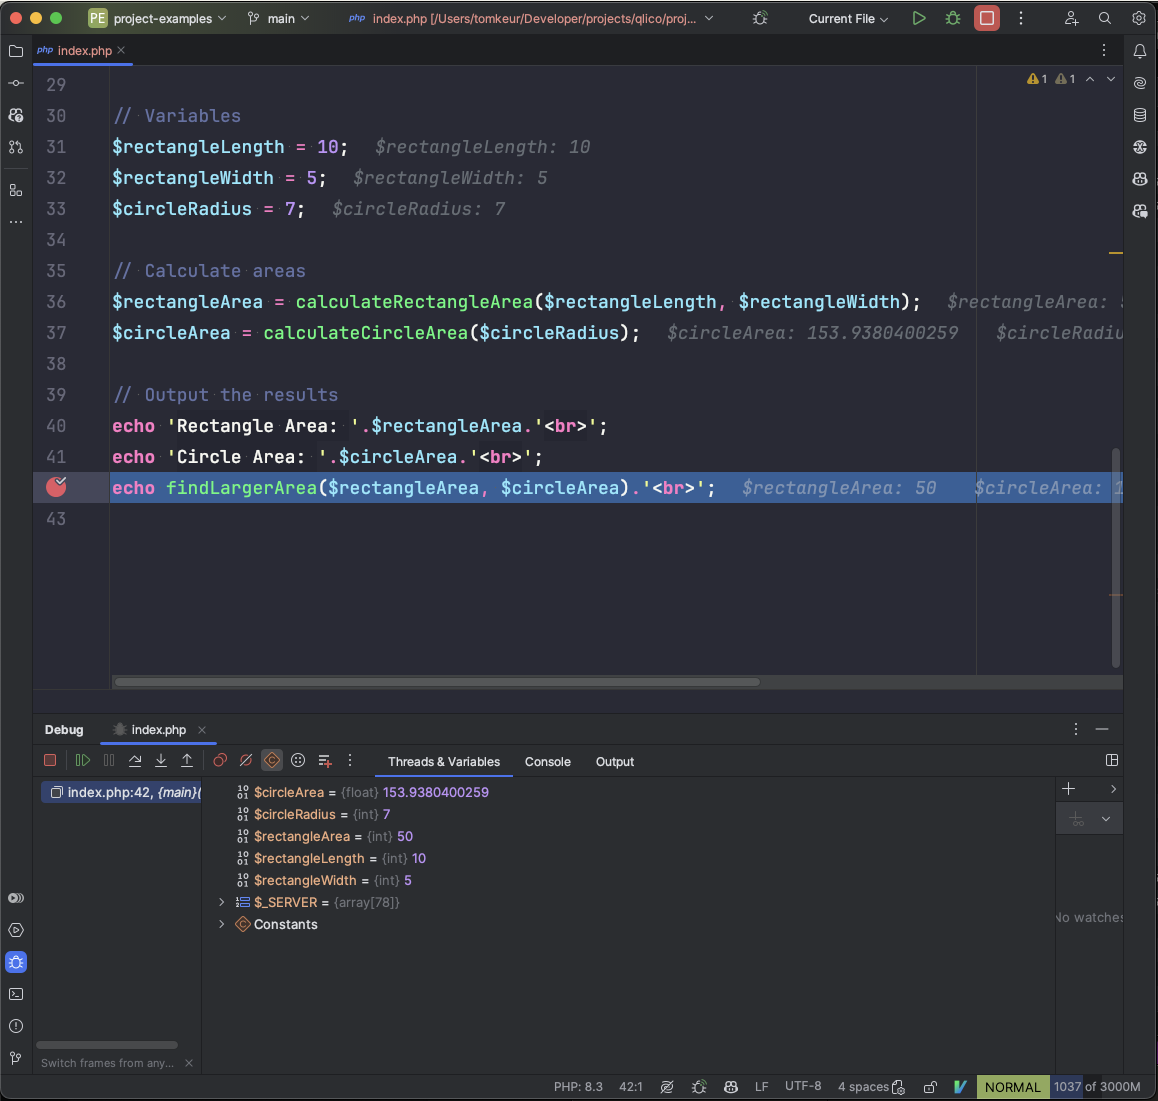
As you can see at the bottom of the screen: There is a debugger attached.
More information about using Debugging in PhpStorm
Visual Studio Code
To enable debugging in Visual Studio Code, please install the PHP Debug plugin by Xdebug first.
A small note on the plugin: This plugin does not support multiple debugging sessions at the same time. See this GitHub issue for more information: Multiple debugging sessions
After installation, in your project open: .vscode/launch.json
And add the following snippet:
{
    // Use IntelliSense to learn about possible attributes.
    // Hover to view descriptions of existing attributes.
    // For more information, visit: https://go.microsoft.com/fwlink/?linkid=830387
    "version": "0.2.0",
    "configurations": [
        {
            "name": "Listen for Xdebug",
            "type": "php",
            "request": "launch",
            "hostname": "0.0.0.0",
            "port": 9003,
            "pathMappings": {
                "/var/www/html": "${workspaceFolder}"
            }
        }
    ]
}
How to start a debug session
Go to Run: "Start debugging"
Add a breakpoint in VSCode
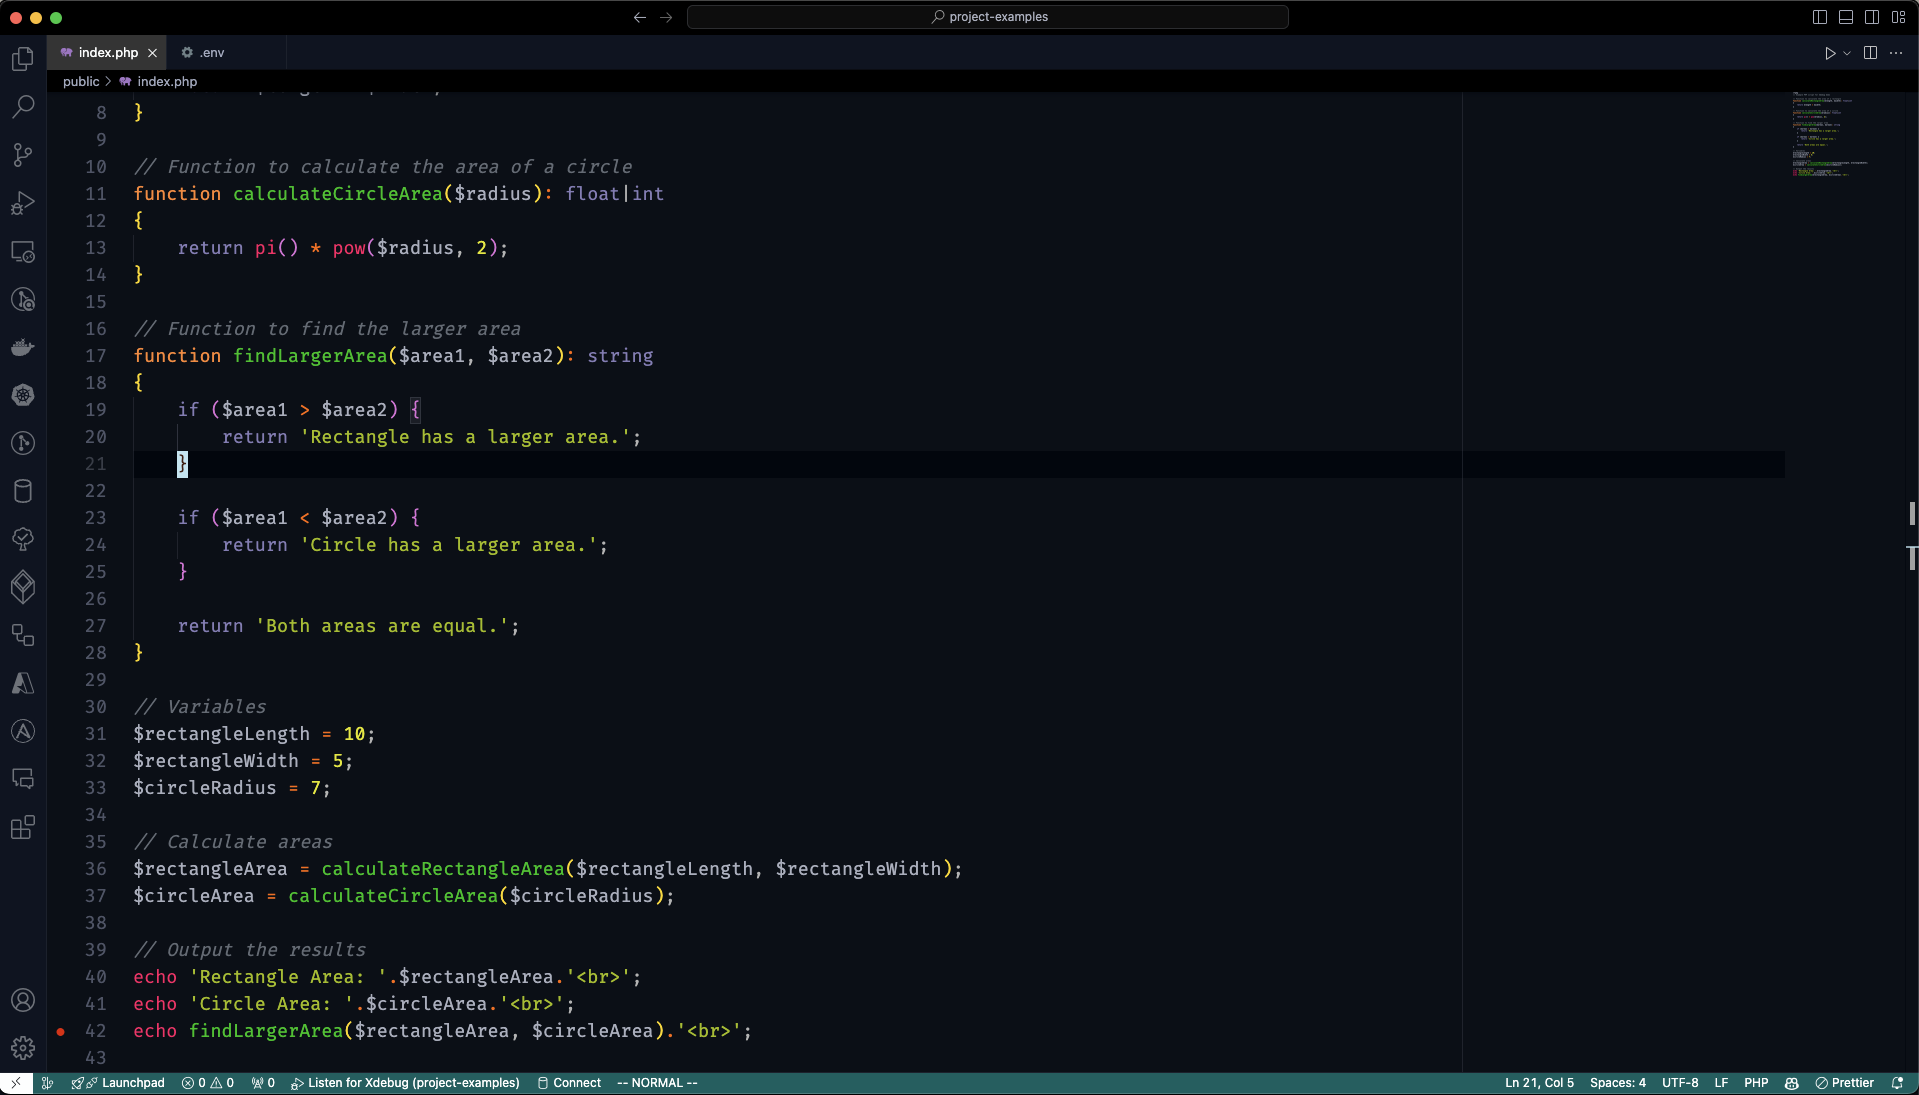
Open your project in a browser
In my example: Visiting http://xdebug-example.qlico
Profit
In Visual Studio Code
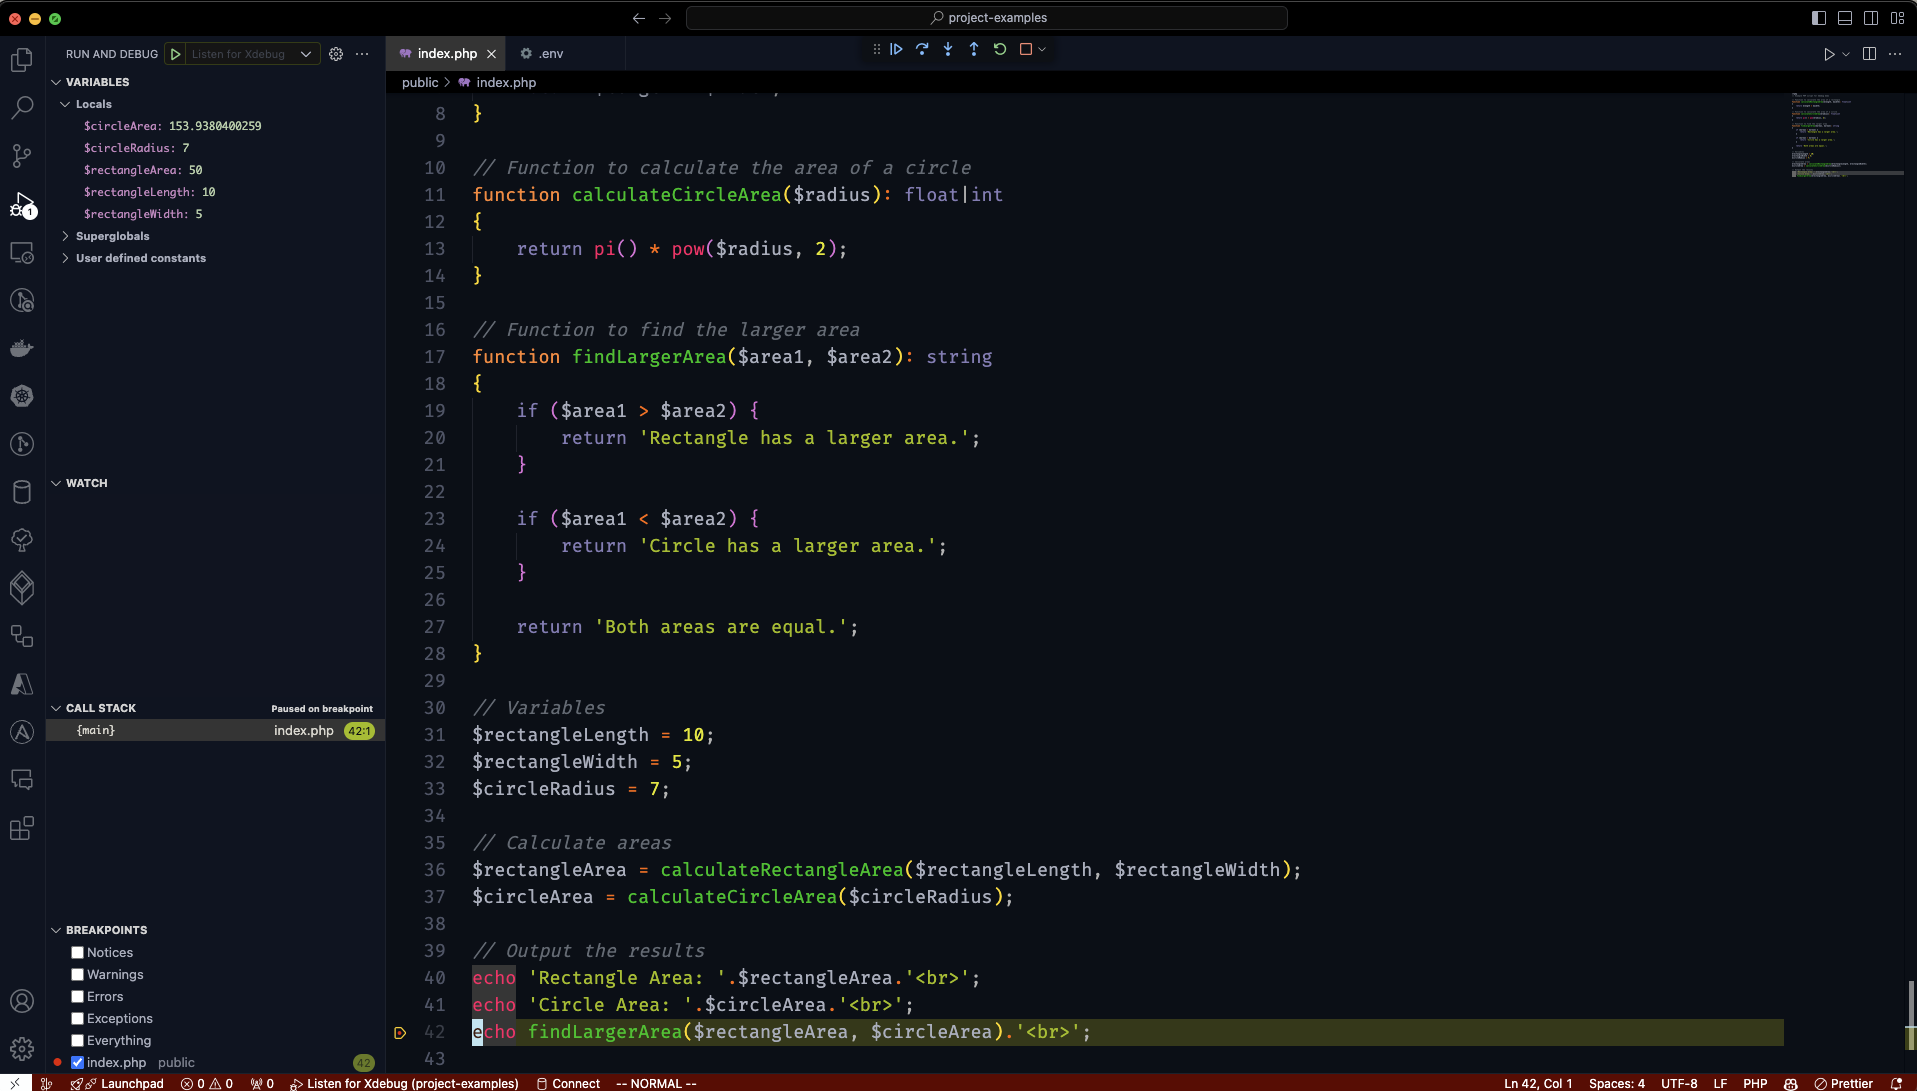
As you can see at the left of the screen: There is a debugger attached.
Debugging CLI scripts
If you want to debug a CLI PHP Script, please use the alias: xphp inside the running PHP Container
For example:
docker compose exec php ash
xphp index.php
# Symfony
xphp bin/console app:command

# Laravel
xphp artisan app:command
It's the same process for PhpStorm
and Visual Studio Code, make sure to set it up first.
Now PhpStorm or Visual Studio Code will open. By default, the php alias inside
Qlico do not have Xdebug enabled, because this can give side effects, for
example when running composer install.